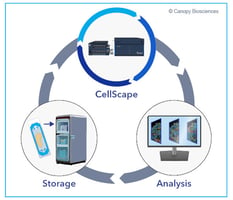
Introducing CellScape™ Whole-Slide Imaging Chamber
Immune cell phenotyping is an important capability for immunology and immuno-oncology research, clinical trials, and therapeutic monitoring. More specifically, immune phenotyping applications include:
- Understanding immune responses to pathogens (viruses, bacteria, parasites, etc.)
- Diagnosing diseases and determining disease severity, particularly for autoimmune disorders and certain types of cancer
- Immunotherapy planning and treatment monitoring
- Determining the impacts of new medications on specific immune populations
- Monitoring transplant patients for immune responses to the transplanted tissue
- Personalized medicine
Technologies for deep immune cell phenotyping
Cell phenotyping classifies cells based on the proteins present on the cell surface. Immune cell phenotyping includes the identification and quantification of lymphocytes (T cells, B cells, and natural killer cells), monocytes (dendritic cells and macrophages), and several subtypes within those categories. The surface markers for cell identification are tagged with fluorescently labeled antibodies and detected using either flow cytometry or immunofluorescence microscopy.
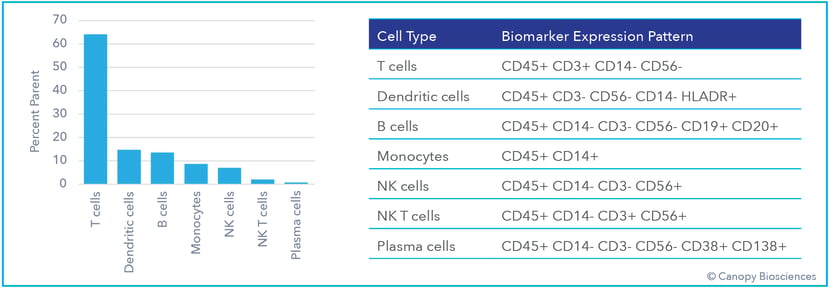
Basic immune cell phenotyping. Immune cells are classified and quantified from biomarker expression patterns shown in the table.
Deep cell phenotyping involves a more precise subclassification of cells, relying on additional distinctive markers that differentiate immune cell subtypes. This process requires the accurate detection of numerous biomarkers, often exceeding 30. Such highly multiplexed analysis using flow cytometry or immunohistochemistry is technically challenging, as many fluorophore spectra overlap and there is a limited number of unique fluorescent signatures that can be detected at once. Spectral unmixing, a mathematical technique aimed at segregating overlapping fluorescent signals, can expand the number of biomarkers that can be analyzed concurrently. However, it is constrained by limited flexibility in assay design and a maximum multiplex capability of around 20.
Employing oligo tags instead of fluorophores for antibody barcording is one way to increase the multiplex ceiling beyond the limitations of spectral space. Unfortunately, this alternative requires additional time and cost due to antibody conjugation, purification, and re-validation of functionality. Mass spectrometry, particularly mass cytometry (CyToF) which utilizes metal-labeled antibodies, provides yet another avenue for conducting high-plex cell phenotyping, but it is expensive and destructive to the sample. Using oligo-tagged antibodies and CyToF both require specialized equipment, reagents, analysis protocols, and expertise to run highly multiplexed experiments, which brings more complexity than conventional flow cytometry or immunofluorescence.
ChipCytometry™ is our multiplexed cyclic immunofluorescence (CyCIF) solution that bridges the gap between high plex and simplicity to enable straightforward and flexible deep cell phenotyping. Uncomplicated and high-plex deep immunophenotyping is accomplished via iterative rounds of staining with standard fluorescent antibodies, imaging with high-resolution microscopy, and photo-inactivation to remove fluorescent signal. High dynamic range images created by combining multiple exposures of every fluorophore allow for biomarker detection and quantification over 6 orders of magnitude. After data collection, images are analyzed with hierarchical gating to classify key immune cell types. Leveraging ChipCytometry technology, the CellScape™ platform provides a highly multiplexed, user-friendly solution for staining and imaging of up to four samples at once with walkaway automation.
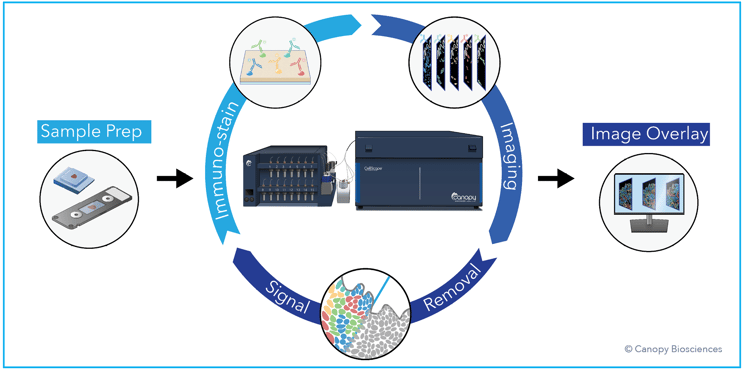
CellScape workflow. The CellScape platform employs iterative cycles of staining with fluorescent antibodies, high dynamic range imaging, and signal removal via gentle photo-inactivation to capture quantitative spatial information about biomarker expression with single-cell resolution. View our CellScape brochure to learn more about the benefits of the instrument.
ChipCytometry provides several key benefits compared to flow cytometry and other methods for analyzing cell suspensions:
- Streamlined assay validation—using cycles of up to 5 antibodies at a time, the ability to re-use the same fluorophores, and the availability of a collection of pre-validated multiplexed assays significantly shortens the validation time compared to validating individual, unique fluorophores for flow cytometry.
- Expand experiment later—because the ChipCytometry workflow is non-destructive, samples fixed in ChipCytometry microfluidic chips can be stored for future re-interrogation if detection of additional biomarkers are needed after the initial study is completed.
- More data from less material—a ChipCytometry microfluidic chip only requires about 2 mL of blood (250,000 cells), which is less than half the volume required for most flow cytometry assays. This advantage makes ChipCytometry a preferred choice for small samples, such as infant blood, or samples that need to be split into multiple assays for analysis.
How high is “highly multiplexed”?
There is not a standard definition for “highly multiplexed.” At Canopy Biosciences, we are still looking for the ceiling for how high we can go with our CellScape cyclic multiplex immunofluorescence imaging platform. As the workflow is non-destructive, the maximum multiplex is theoretically only limited by the availability of specific and fluorescently labeled antibodies to the desired targets. To demonstrate this idea, ChipCytometry was used to detect, quantify, and analyze a large number of clinically relevant biomarkers from a PBMC sample. This highly multiplexed dataset enabled deep immune profiling and cell phenotyping, including analysis of B cell subtypes, T cell subtypes, monocytes, dendritic cells, apoptosis indicators, and activation markers, all from a single sample. After cyclic labeling, imaging, and photo-inactivation, 74 biologically relevant biomarkers were detected from the same sample. Using the highly multiplexed dataset, immune cells were then deeply phenotyped based on biomarker expression profiles.
The use of such a highly multiplexed assay enabled far more detailed analyses of immune cell subtypes and profound phenotyping than the standard/basic immune cell classification illustrated in the first graph above. Expression of exhaustion indicators, immune checkpoint receptors like CD274/CD279 (PD-L1/PD1), and transcription factors were analyzed in the T and B cell populations. Monocytes and dendritic cells were also subtyped based on immune activation expression patterns.
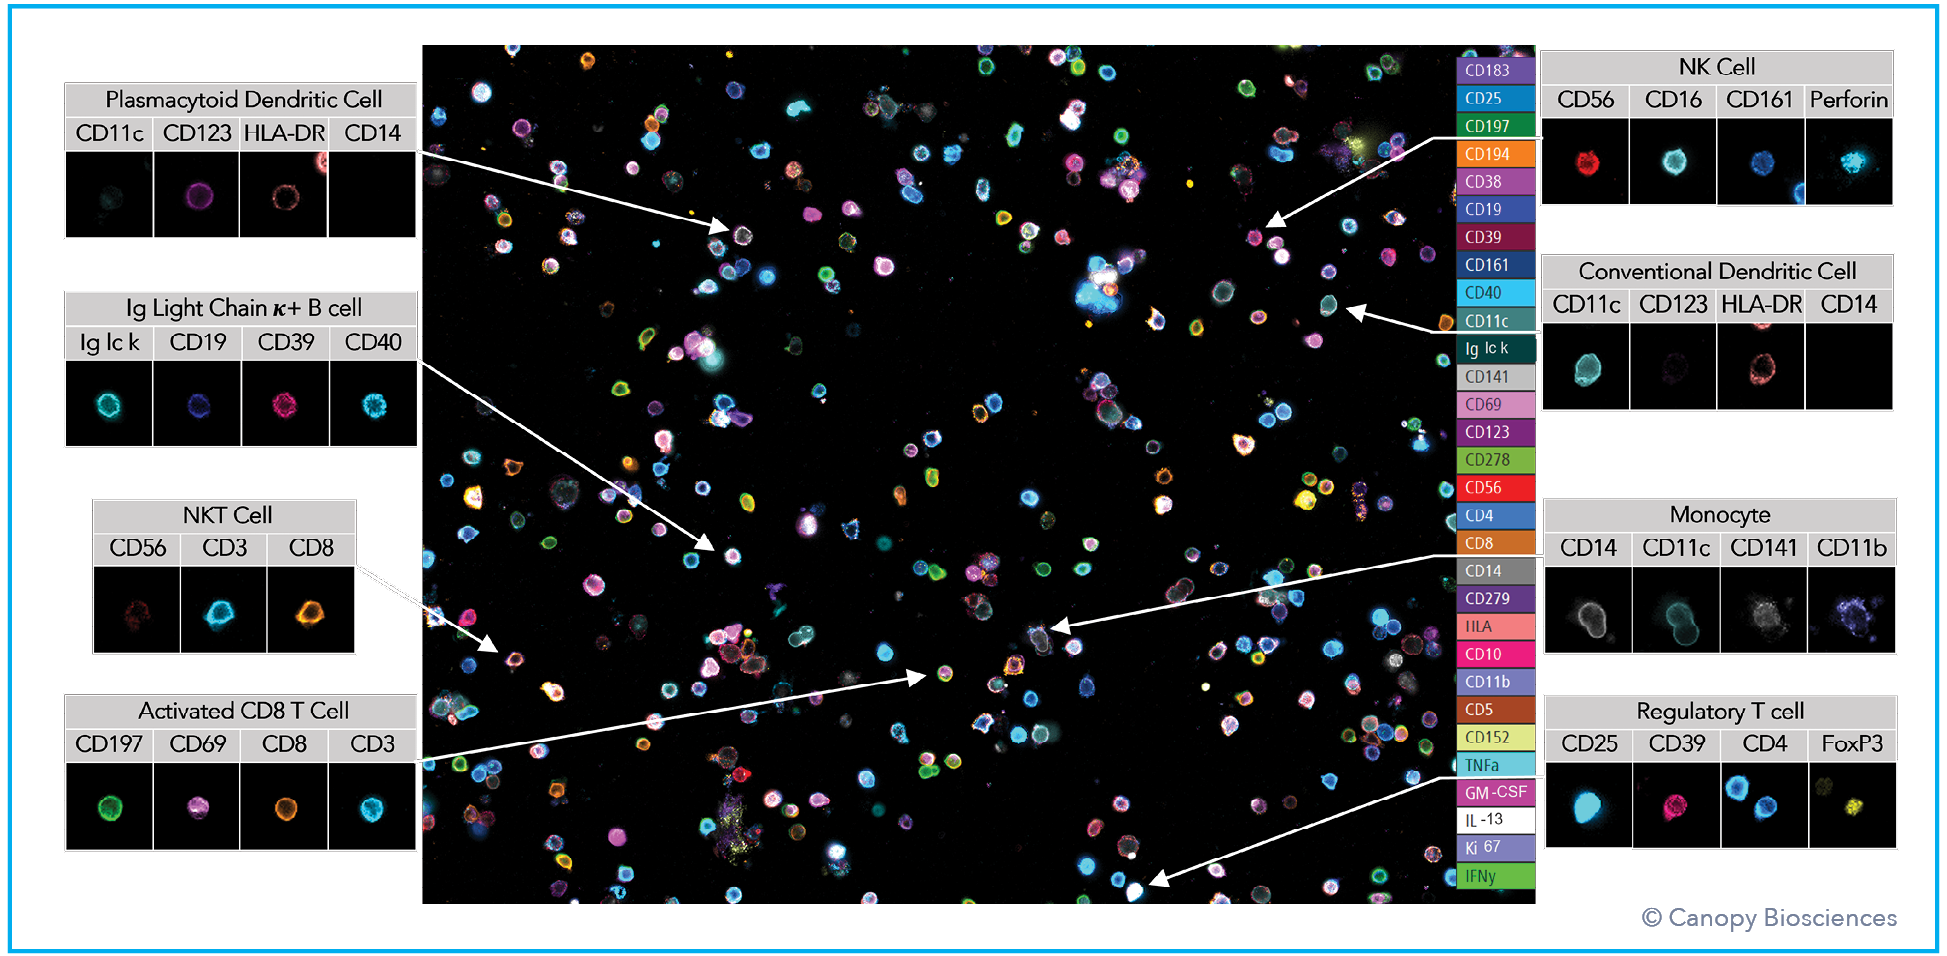
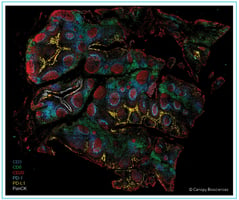
Example images of individual cell types. Immune cells are identified from image overlays of 74-plex PBMC cell phenotyping analysis, with select biomarkers shown as indicated in legend.
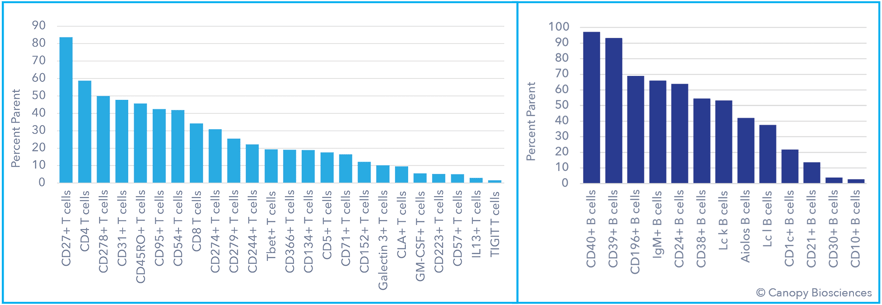
Deep phenotyping of T and B cells. Use of a highly multiplexed assay detecting 74 biomarkers enables deep phenotyping of T and B cell subtypes, including expression analysis of exhaustion markers, immune checkpoint receptors, and transcription factors.
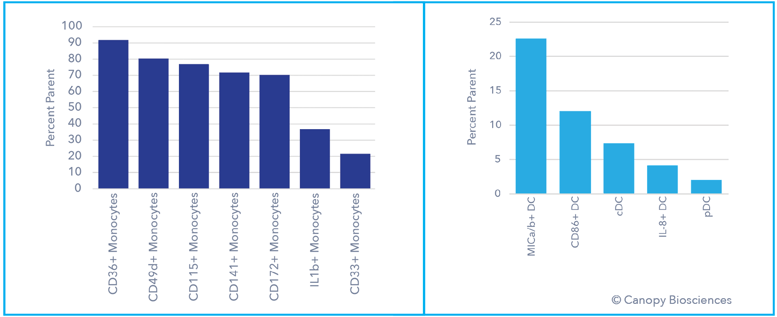
Deep phenotypic analysis of monocytes and dendritic cells. With the 74-plex assay, subtyping of other immune cell types can also be completed by measuring additional biomarkers, including activation indicators and interleukins.
Deep immune profiling data analysis
Perhaps the most significant hurdle in cell phenotyping is the analysis of large datasets. Compiling the image-based readouts from many biomarkers requires massive computing power and specific software algorithms. Fortunately, the cloud computing BIOS platform of Enable Medicine provides the capability to access cell segmentation, gating, and unsupervised clustering algorithms, leveraging the power of AI to generate meaningful results from highly multiplexed datasets.
Summary
Highly multiplexed biomarker analysis allows for deep phenotyping and cell subtyping, detection of rare cells, and monitoring of cellular processes including apoptosis indicators and activation markers. ChipCytometry is a simple, easy-to-use workflow for deep immune phenotyping that utilizes cyclic immunofluorescence imaging for higher multiplex analysis than flow cytometry and is compatible with both suspension cells and tissue samples. Using ChipCytometry for deep phenotyping analysis of a PBMC sample, 74 unique biomarkers were detected. This degree of high multiplex is not the upper limit that can be achieved with ChipCytometry, as assay optimization would allow additional markers to be detected. Recent strides in artificial intelligence have allowed for computer-assisted deep phenotyping by pairing CellScape data with analysis on the Enable Medicine cloud-based BIOS platform.
At Canopy Biosciences, we continue to push the envelope on high-plex, high-quality immunofluorescence microscopy. Read our Highly Multiplexed Immune Cell Phenotyping Application Note for more information on high-plex PBMC analysis or explore our Resources to see what else you can learn using ChipCytometry.