Introducing CellScape™ Whole-Slide Imaging Chamber
Learn about High Dynamic Range (HDR) microscopy—what it is and why it will add value to your immunofluorescence imaging.
High dynamic range in the fall
Autumn is a beautiful time of year in many parts of the world. The vivid colors displayed by senescent leaves are a majestic sight to behold. When the sun strikes the fall foliage, the vibrancy of reds, oranges, and yellows appear a truly remarkable feat of nature.
But have you ever noticed that taking a photo of fall colors doesn’t accurately capture the range of color intensity the way that your eyes see it? The human eye, supported by complex processing by the brain, can discern detail from a much wider range of light input than even the best camera can. One reason for this discrepancy is dynamic range.
Dynamic range is the difference between the highest signal and the lowest signal. More specifically, in the context of photography and imaging, dynamic range refers to the difference between the lightest lights and the darkest darks that are captured in a single image. The dynamic range of any given photo is limited by the exposure time, which controls the amount of light that is let into the camera. When using single exposure photography, the exposure time must be chosen carefully to obtain images that are bright enough to see the subjects of interest but not so bright that details are washed out by too much light.
Sometimes there is no single exposure time that can accurately capture details from scenes with both high and low lighting. Think about taking a photo of a person standing in front of a sunny window—the person is usually completely dark and indistinguishable, while the scene outside is overly bright and washed out. The dynamic range of that single exposure image does not support distinguishing details from the darkest darks or the lightest lights. Your eyes, however, can clearly see both the person near the window and the scenery outside at the same time. This is what high dynamic range (HDR) imaging can do, too.
HDR imaging is a technique that overlays multiple different exposures of the same scene to create a single, combined image that captures a much wider range of darks and lights than any single exposure can. This is particularly impactful when capturing a crisp autumn day:
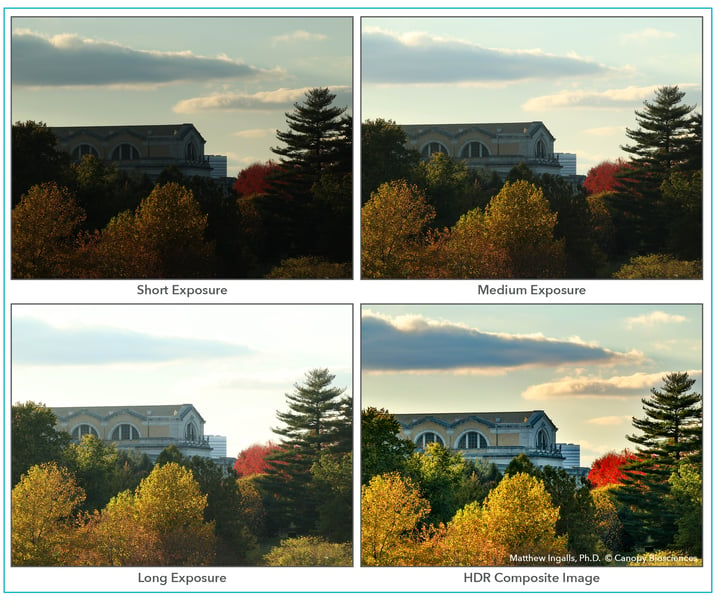
Autumn in St. Louis, captured in HDR. Colorful trees in Forest Park (St. Louis, Missouri) were captured using multiple different exposure times. An HDR composite image (bottom right) was created from overlaying exposures.
While the general brightness of the HDR composite image looks similar to that of the medium exposure, a closer look finds that the HDR image displays details that no single exposure can. The HDR composite maintains the detail and coloring in the clouds that is no longer visible in the longer exposures while also capturing the layers of trees that are invisible in the shorter exposures. Additionally, the fall color is the most vivid in the HDR composite.
Here is another example of fall color captured in HDR—note how the composite image captures and preserves the clouds:
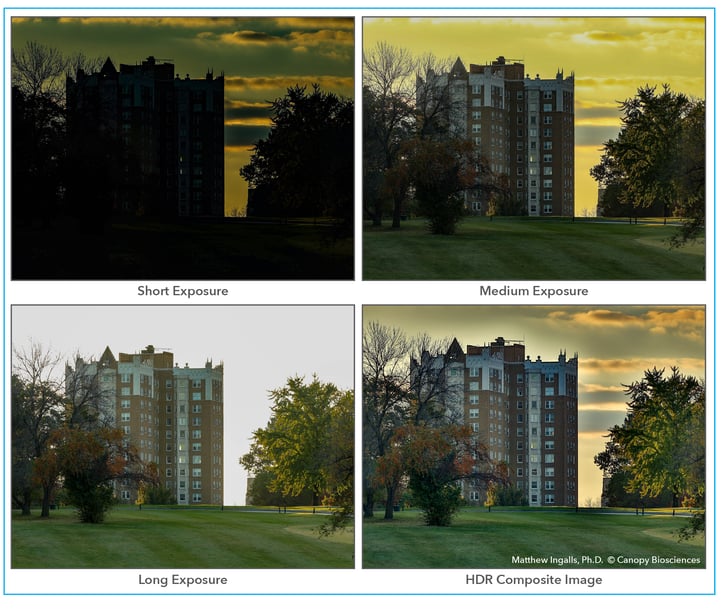 Autumn sunset, captured in HDR. A building, colorful trees, and sunset were all captured using different exposure times. An HDR composite image (bottom right) was created from overlaying exposures.
High dynamic range for accurate quantification
To depict dynamic range another way, a detection assay can be visualized by a graph of signal intensity versus abundance of an analyte that is being measured:
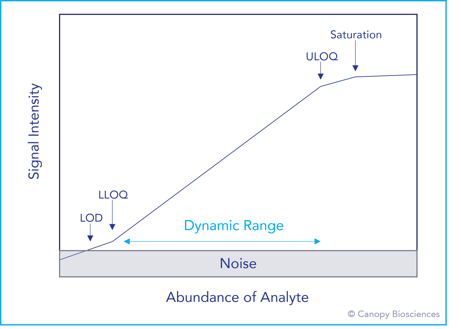
Dynamic range depicted as signal intensity versus analyte abundance. Every detection method has a limited range of concentrations that can be accurately detected and quantified. At the bottom end of the range is noise, where background signal cannot be distinguished from a positive signal. LOD is the limit of detection, or the smallest amount of analyte that can be reliably detected above the noise. LLOQ is the lower limit of quantification, or the beginning of the dynamic range where signal intensity is linear and quantifiable. ULOQ is the upper limit of quantification, or highest amount of analyte with linear, quantifiable signal. Saturation is when the analyte concentration is so high that the detection method cannot capture any additional signal. The dynamic range is the area in between the upper and lower limits of quantification. No quantifiable information can be gathered from signals above or below these limits.
In the case of image capture, the analyte is light, and the range of signal intensity values that can be captured is dependent on the exposure time. Using multiple exposure times dramatically expands the amount of light that can be captured and enables a wider range of light and dark detail that can be visualized in a single image. Returning to the graphical depiction, multiple exposure overlays could be demonstrated like this:
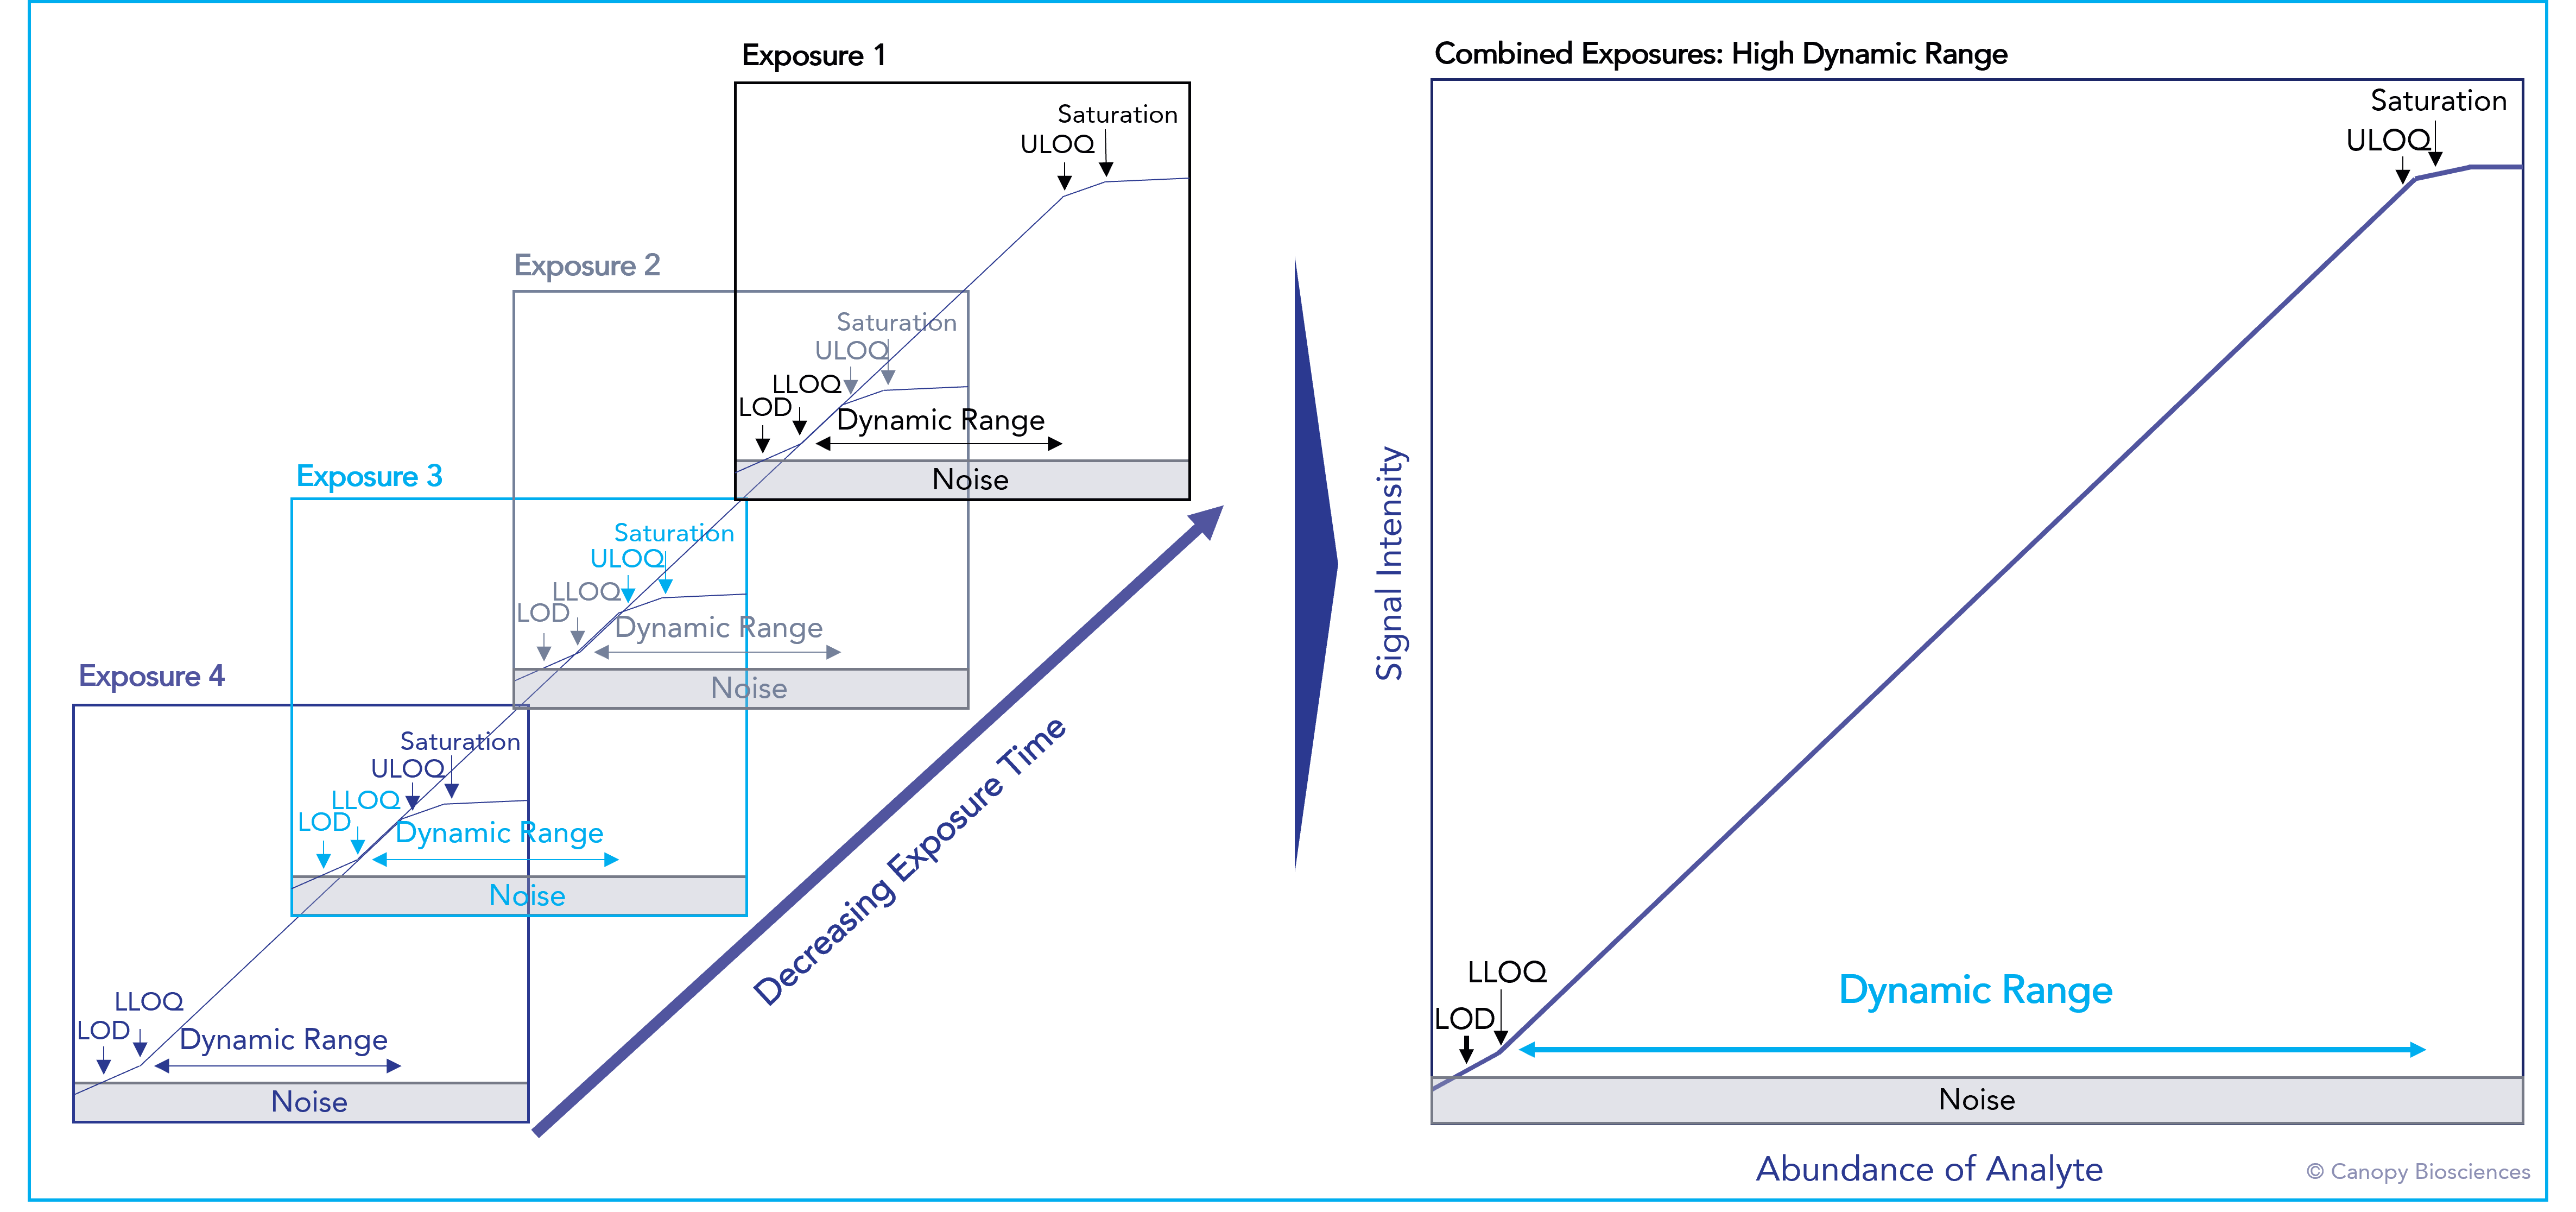
HDR detection methods extend the range of analytes that can be visualized and quantified. Combining multiple exposures, each with their own dynamic ranges, expands the total dynamic range by multiple orders of magnitude.
High dynamic range in microscopy
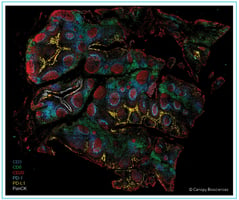
Limitations in dynamic range from single-exposure imaging also exist in microscopy. A common microscopy method, immunofluorescence imaging, visualizes cells and tissues by staining them with fluorescently labeled antibodies and detecting the intensity of fluorescence signal as light. A single exposure of an immunofluorescence microscopy image can only capture 2-3 orders of magnitude of light intensity. However, the biological range of protein expression is 6-7 orders of magnitude—far exceeding the dynamic range of a standard camera. Fortunately, high dynamic range microscopy can accurately capture fluorescence signal from that wide of a range of biomarkers, as shown here:
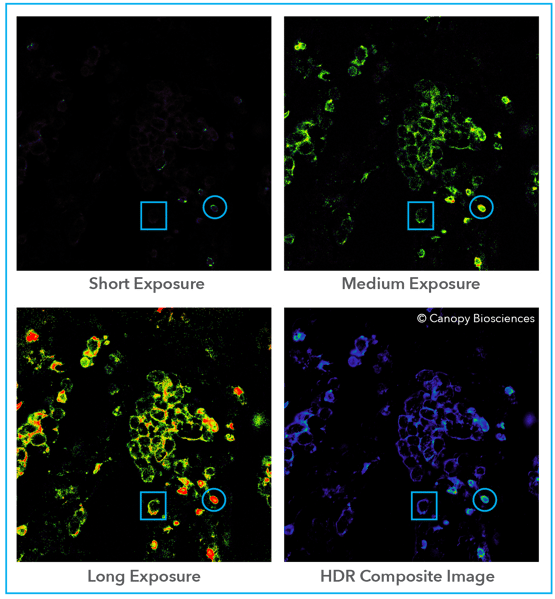
Precise spatial multiplexing using HDR microscopy. A human non-small-cell lung carcinoma tissue sample was imaged using a fluorescently labeled antibody targeting surface biomarker CD4. Within each exposure, the color indicates the intensity of light signal, with red indicating that the signal is beyond saturation. The short exposure was the only one to capture a non-saturated image of the cell with the blue circle, while the cell in the blue rectangle remained invisible. The cell in the blue square became visible in the longer exposures, but at the cost of no longer detecting linear signal from the cell in the circle. By overlaying the exposures in the HDR composite image, both cells can be visualized and have quantifiable fluorescence signal at the same time.
HDR microscopy provides value to immunofluorescence imaging experiments in several ways:
- Never miss a cell due to its low level of biomarker expression.
- Precisely capture fluorescence signal intensities spanning a dynamic range of approximately 6 orders of magnitude.
- Obtain accurate relative quantification of biomarkers, enabling cell identification and subtyping based on specific expression levels rather than only presence/absence of detectable signal.
- Use less sample by not wasting any on exposure optimization.
- Free up time with walkaway automation for exposure range selection.
Without imaging tissues in HDR, you risk missing detection of cells with fluorescence signal that is below the LOD of exposures that are not optimized. You would also lose out on the capability to accurately quantify the fluorescence signal across relevant biological ranges. HDR microscopy increases imaging efficiency and elevates immunofluorescence from simple pictures to a quantitative and powerful assay method.
How to access HDR microscopy
Like viewing the beauty and detail of nature changing seasons using the power of our own eyes, we can view the full natural range of biomarker expression in a tissue using high dynamic range microscopy. However, HDR is not a standard feature of most microscopes or spatial biology imaging platforms. HDR microscopy is uniquely available through our CellScape™ platform, featuring ChipCytometry™ technology. Learn more about the power of HDR in our CellScape brochure, or partner with Canopy Spatial Services™ and see what CellScape can do for your research.